What is it? A strategy from “Data Driven Dialogue: A Facilitator’s Guide to Collaborative Inquiry” used to structure collaborative conversations about their programs and progress.
When would I use it? Since this strategy is designed to promote group reflection, this strategy is best at the midpoint or end of a project/program, upon the implementation of a new program, or when reflecting on the entire year. I used this to guide district teams in analyzing and reviewing their current AIS plans before we conducted a regional “swap meet.” My goal was to have them reflect on what was working in their plans that they wanted to share with others, but also to determine where they thought their plan needed improvement so that they could listen for or question their colleagues about how they were dealing with that particular issue.
Materials needed: Post-it notes (two different colors), chart paper, markers (a.k.a. the Staff Developer’s Toolkit!)
How does it work?
1. Individually, participants think of three high points related to the topic of the meeting. They write one idea on the same color post-it note, one idea per note.
2. Next, they think of three low points related to the topic. Again, they write each idea on a different color post-it note; one idea per note.
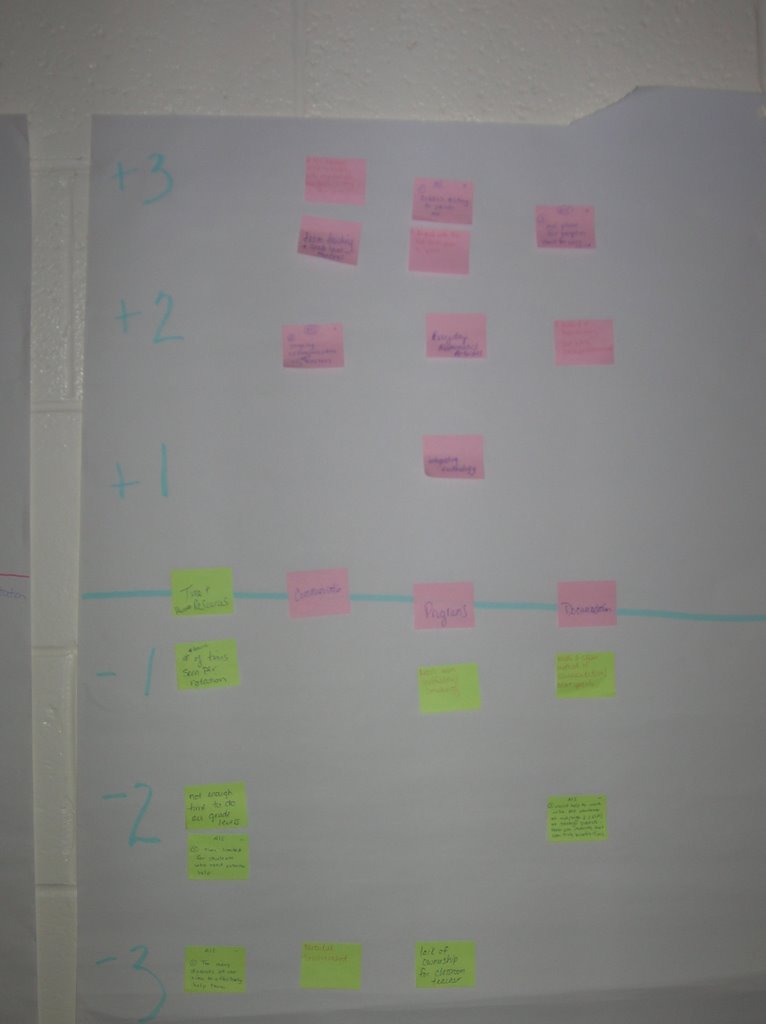
3. On the chart paper, draw a grid as shown in the picture above. Have participants post their “highs” and “lows” on the chart paper, rating them by degree (+1, +2, +3, -1, -2, -3).
4. As a group, review the wall graph. At this point, I veered from the protocol in the book and had participants try to categorize their post-its and group them. They then labeled the axis with those categories. (The book provides meditative questions instead).
Note: I posted additional photos of the grid and group work on my Flickr account.
Reflections: As I wandered the room touching base with each district group, there were very powerful conversations happening!! It was interesting to see that what some people thought were “high, “others had marked very low. It prompted some nice discussion and clarification of the issues. I thought it was helpful to have them categorize the post-it notes, as I know from previous experience that it seems that not everyone feels comfortable speaking up when questions are asked of the group. I felt that it promoted discussion and even deeper reflection of the AIS plans in this case.
Some groups wanted clarification of how to place their post-it notes on the grid – was the -1 the lowest of the low or the least of the low. When that came up, I explained that it didn’t matter to me, as long as it made sense to the group. I probably should have made that point more clearly to the groups, but it wasn’t a real focal point for me – the conversation was. If you prefer that all groups have the data grouped similarly for some reason, you might want to be a bit more explicit than I was!
Reference: Wellman, B. & Lipton, L. (2004). Data-Driven Dialogue: A Facilitator’s Guide to Collaborative Inquiry. Sherman, CT: MiraVia, LLC.
1 comment:
What a great use of this strategy! I'm always using different activities from her book but I haven't tried this one yet. I think I'm going to try it at a meeting on the 1st. I'll let you know how it goes.
Post a Comment